Now that we’ve entered January 2025, it’s the perfect moment to reflect on Xanadu Gallery’s sales performance over the past 12 months. This annual exercise is not just about reviewing numbers; it’s about extracting actionable insights and sharing lessons that can benefit not only my gallery but also artists striving to navigate the dynamic art market. Let’s dive into the details and explore the key metrics that shaped our year.
The Power of Metrics
Diving into sales data offers clarity that transcends the emotional highs and lows of daily operations. As business owners, we often tether our outlook to immediate results. A great sales day can feel like a windfall, while a slow day might suggest impending doom. Regularly analyzing hard numbers balances this perspective, helping us make informed decisions and set realistic goals.
One revealing metric we calculated this year was the number of days where sales didn’t meet the threshold to cover operating expenses. Out of 365 days, there were 62 such days. While it might emotionally feel like there were far more of these challenging days, this data highlights how critical it is to focus on overall trends rather than daily fluctuations.
A Return to Growth
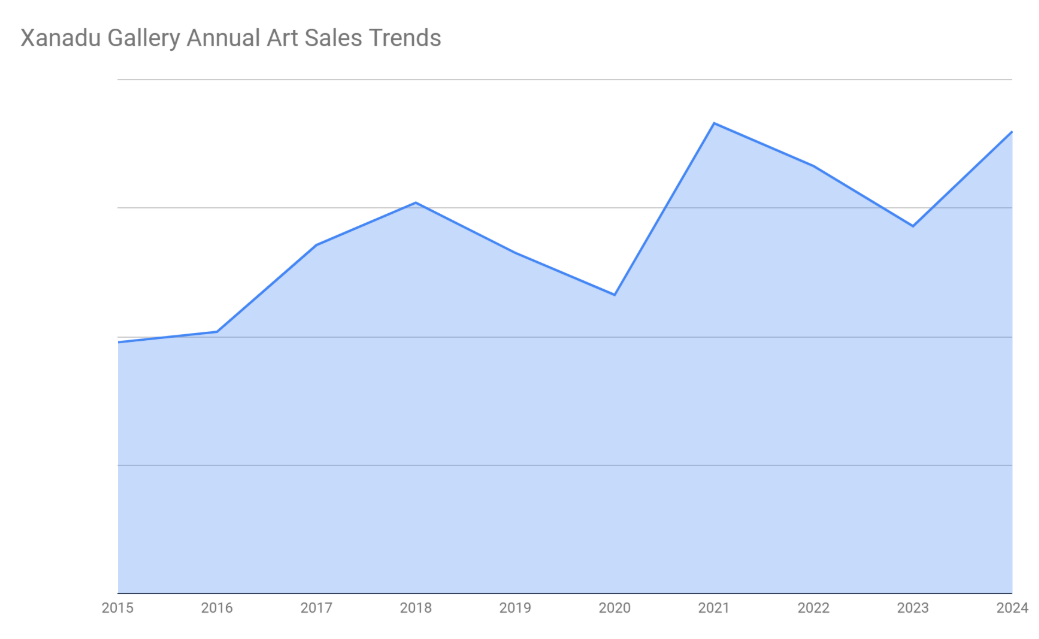
This year brought a welcome shift: a reversal of the downward sales trend we’ve seen since the record-breaking highs of 2021. Our total sales volume in 2024 exceeded 2023, with significant contributions from high-ticket purchases. Here’s a closer look at the trends:
- 2024 Total Sales Growth: Up compared to 2023, signaling recovery after two years of decline.
- High-Value Purchases: A noticeable increase in sales of artworks priced $5,000 and above.
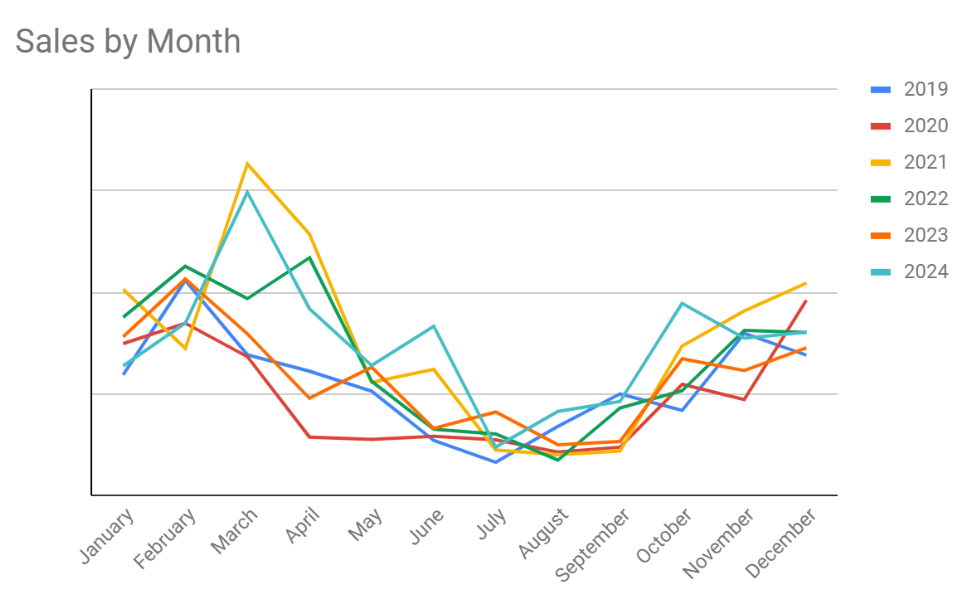
- Seasonality: Predictably, our summer months (June-September) were the slowest, while March and April brought in robust revenue.
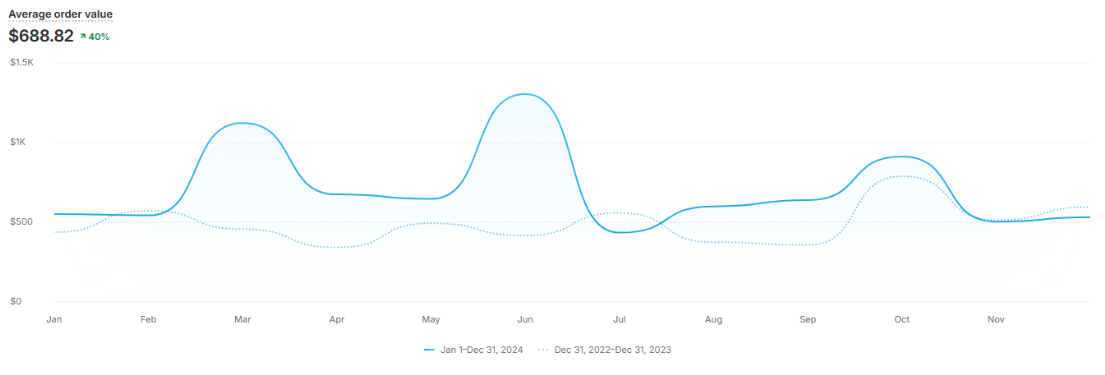
- Average Order Value: $688, with significant fluctuations. For example, a single large sculpture sale in June helped stabilize an otherwise slow month.
Bread-and-Butter Sales and High-Value Transactions
Analyzing price points revealed two key drivers of our success: high-volume, lower-priced sales and substantial high-value transactions.
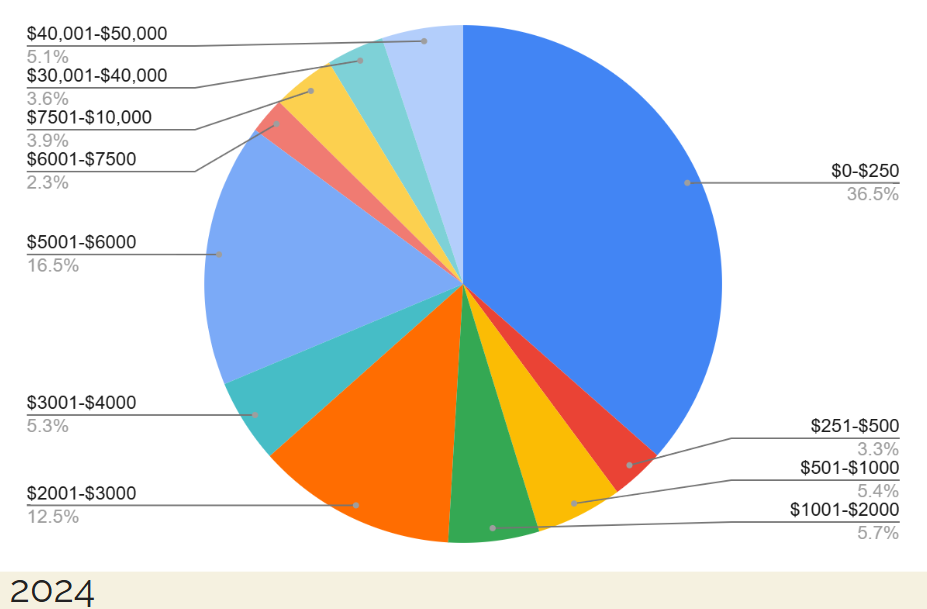
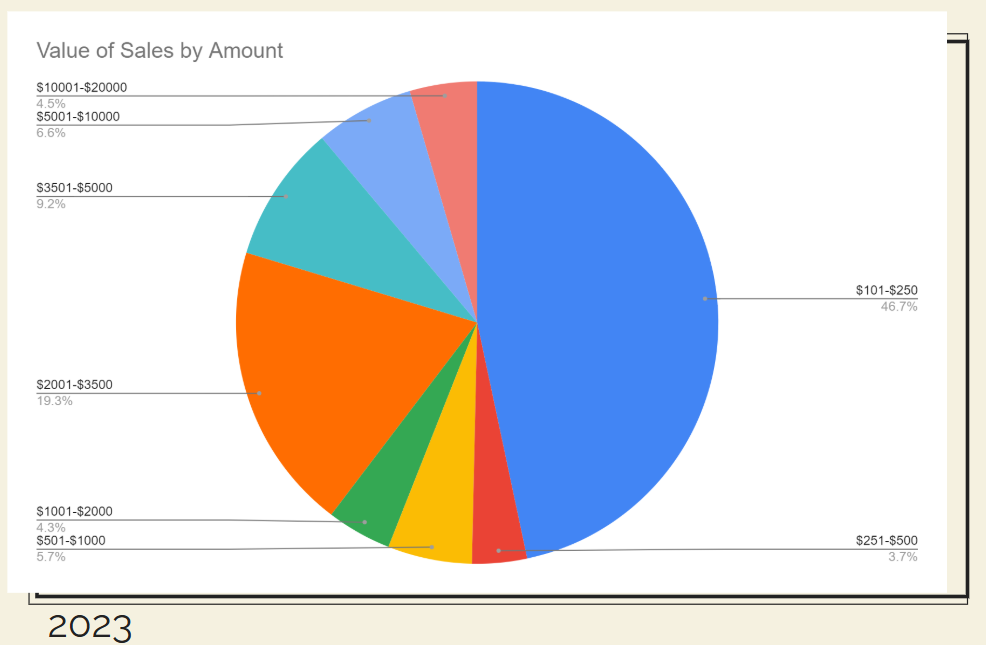
- Lower Price Points ($0-$250): This category accounted for 36% of our total revenue. These sales often come from items like prints or smaller works, which act as a gateway for new collectors.
- High Price Points ($5,000+): These accounted for much of our growth this year. Sales in the $30,000-$50,000 range, including a standout $45,000 sculpture, significantly boosted overall revenue.
- Breadth of Price Points: The diversity in price points ensures we cater to both entry-level buyers and seasoned collectors.
A comparison to 2023 shows a shift in buyer behavior. While lower-priced items remained stable, high-value purchases surged. For example, 2024 saw several sales in the $40,000-$50,000 range, compared to no such sales in 2023.
Online vs. In-Gallery Sales
The interplay between online and in-gallery sales continues to evolve. Here are the key metrics:
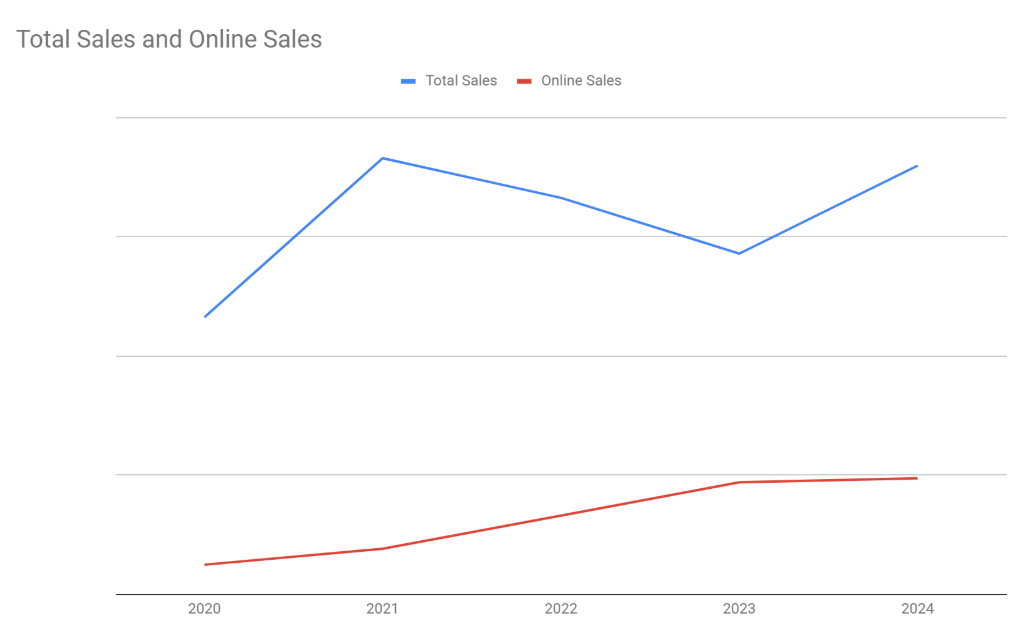
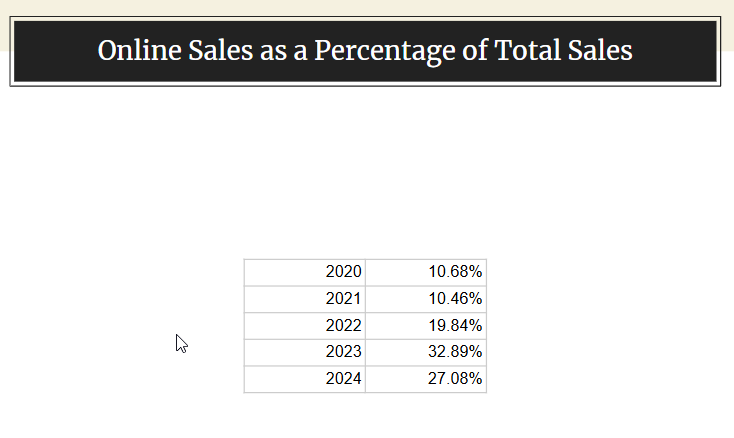
- Online Sales Contribution: 27% of total sales, down slightly from 2023’s 33%, but with a higher average transaction value.
- Website Traffic: 104,000 user sessions, a 30% decrease from 2023’s 148,000. Despite fewer visitors, conversion rates improved slightly (+3%).
- Social Media Impact: Reduced focus on social media advertising led to fewer sessions with cart additions (-41%) and completed checkouts (-27%).
These numbers emphasize the importance of consistency in online efforts. While in-gallery sales dominated this year, the potential of online sales remains significant, particularly as average transaction values grow.
Customer Insights: The Role of Top Buyers
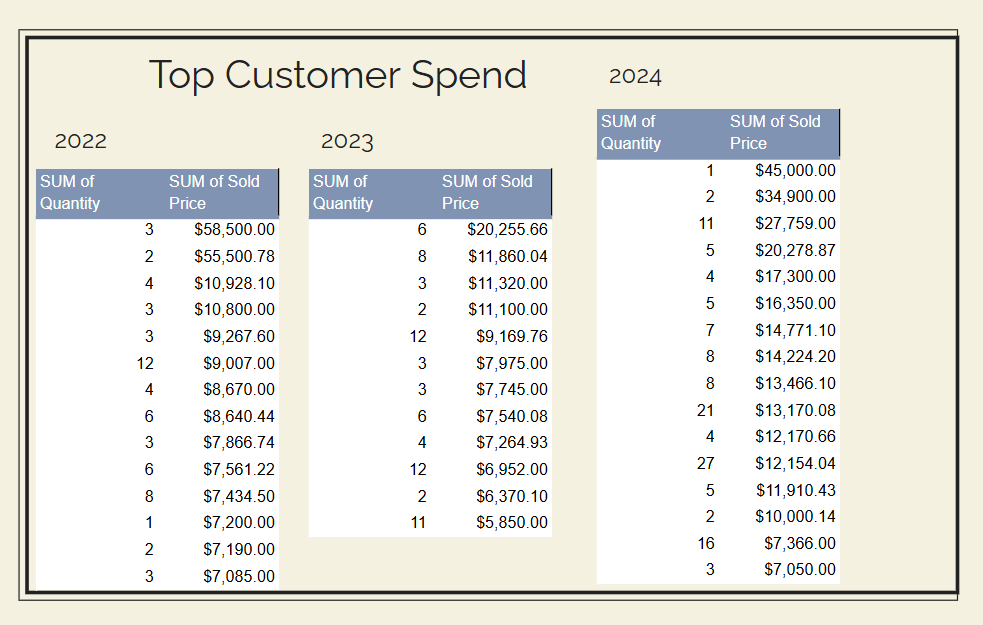
Top customers played an outsized role in our success. The top 15 customers accounted for a significant portion of our total sales, with the highest single purchase at $45,000. Here’s the breakdown:
- Top Customer Spend: $45,000 on one large sculpture.
- High-Value Buyers’ Behavior: These customers often returned multiple times, making additional purchases throughout the year.
Cultivating relationships with these collectors requires dedicated effort—personalized communication, updates on new works, and tailored marketing. High-value buyers are also far more likely to continue purchasing, making them a key focus for ongoing efforts.
Lessons from Inventory and Artist Performance
This year, we’ve seen how the right inventory mix and artist alignment can influence sales.
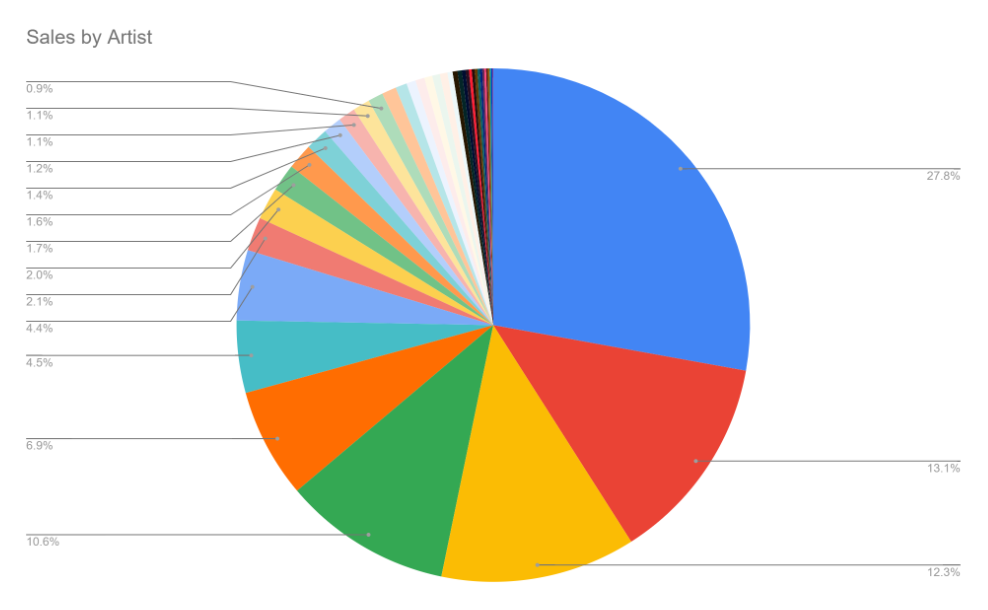
- Top Artist Contribution: Our highest-selling artist, whose pieces average $200, accounted for nearly 30% of total revenue through volume sales.
- Diverse Artist Performance: Two artists moved into the top three quarters of sales after implementing feedback on market demand and subject matter.
- Style and Format Trends:
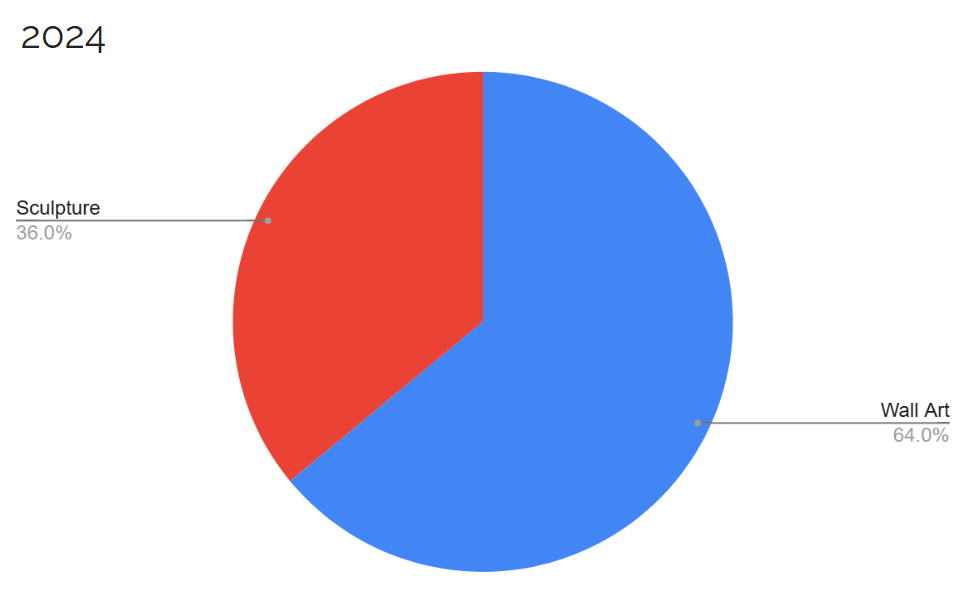
- Wall Art vs. Sculpture: 36% of total sales came from sculpture, with wall art contributing the remaining 64%.
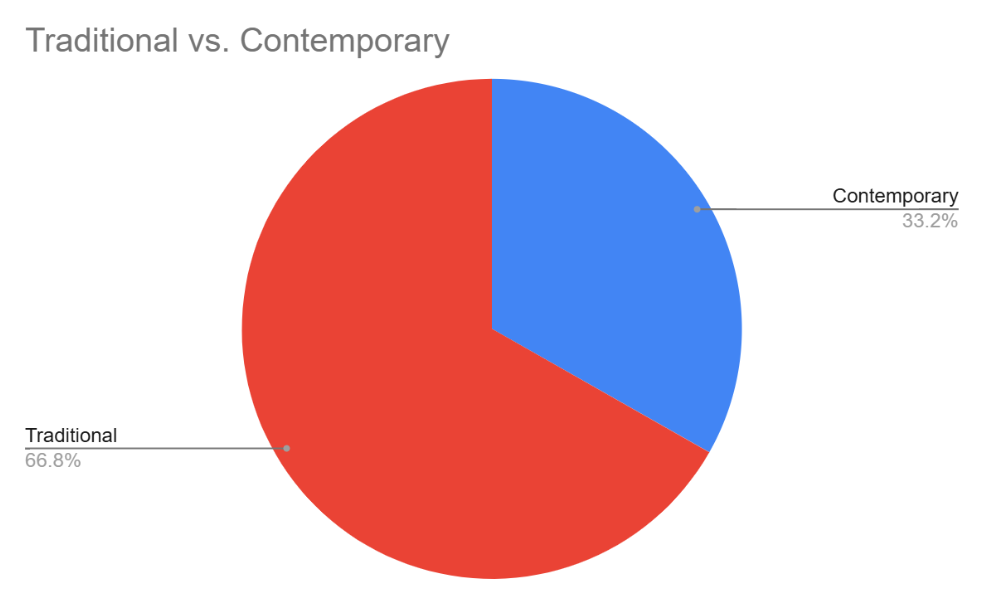
- Traditional vs. Contemporary: 66% traditional vs. 34% contemporary sales, reflecting our gallery’s stylistic balance.
Providing artists with actionable feedback about what’s selling (e.g., subject matter, sizes, and formats) has proven effective. Artists who adjusted their offerings saw notable increases in sales.
Expense Breakdown
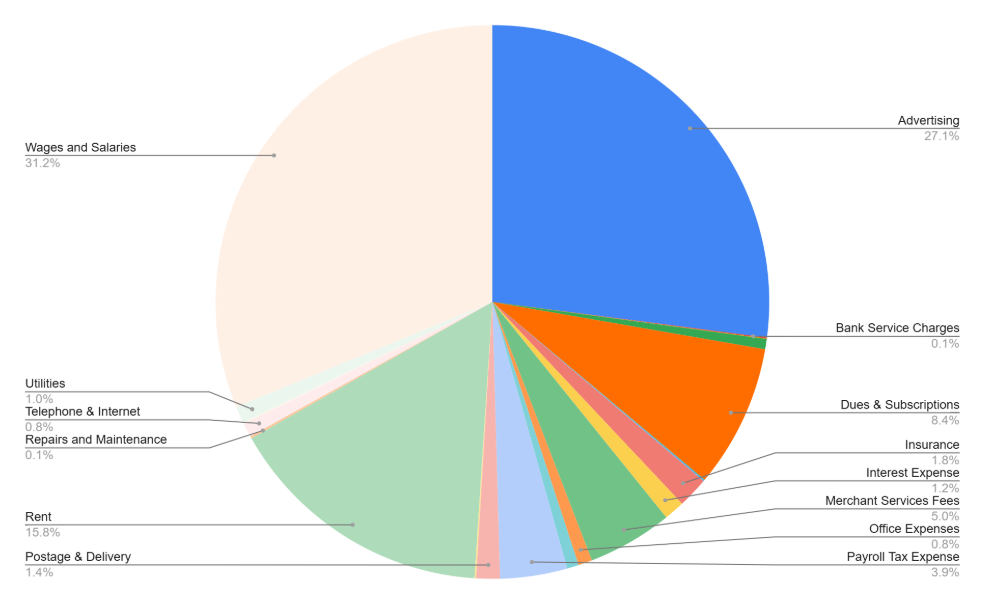
Running a gallery involves significant operational costs. Keep in mind that this reflects operating expenses and does not show our artists’ commission payments, which come out before expenses. Here’s how our expenses broke down:
- Wages and Salaries: 32% of total expenses, reflecting the importance of a dedicated and knowledgeable team.
- Advertising: 27%, driven primarily by social media efforts.
- Rent: 18% of expenses, emphasizing the importance of a prime location.
- Subscriptions and Shipping: 8.4%, covering our Shopify platform and delivery logistics.
It’s crucial to keep expenses stable, especially during slower months. Building reserves during peak periods ensures smooth operations year-round.
Looking Ahead to 2025
As I plan for 2025, my focus will be on “redoubling” efforts. This means:
- Recommitting to Social Media: Increasing online engagement and advertising to boost website traffic and sales.
- Enhancing Artist Collaboration: Providing constructive feedback to help align artists’ work with market demand.
- Cultivating Top Collectors: Strengthening relationships with high-value customers through personalized attention.
- Diversifying Inventory: Maintaining a balanced range of price points to attract both new and established collectors.
While predicting the future is always a challenge, focusing on these fundamentals positions us for continued growth.
Join the Conversation
What insights have you gained from reviewing your own sales data? Have you noticed similar trends in your art business? Share your thoughts and strategies in the comments below. And if you haven’t already, subscribe to the blog for more in-depth discussions and actionable advice to elevate your art career.
Thanks for sharing that information, Jason. That’s the kind of helpful insight I wish more businesses, including art fair producers would share.
Extremely helpful, Jason! I always enjoy hearing the real story.
My particular challenge comes from living in a well-knownart-oriented area with a huge number of artists per square inch, probably the most intense concentration in the country. The pressure on the local galleries is intense, and if you look at their websites, the area is almost totally dedicated to Western Contemporary. So finding a home for my southwest landscapes without Indians, cowboys, and horses, etc., is a challenge…which is this year’s job.
I can assure you that the heavy reliance on “cultural” art is not confined to your area. Every state I’ve lived in, 13 to date, seems to aim at the person passing through a bit more than the person living there. Your area has a wider variety of “culture” to pull from than most and a main part of it’s enchantment IS the landscape.
Ginny
p.s. The main variety in my current location is sky, cows and the attendant cowboys…and dinosaurs.
This is great! Good to know. I wish we could see what all galleries do. It’s been a slim year and a half. Investors have been selling out but not increasing their intact in fact lowering it quite a lot around Dallas. Very interesting.
Hi Jason, You mention that one artist dominated sales with low priced works. How did that person fare with keeping their business going with higher prices for materials, shipping, gallery commission and production time? With sales of $200 and under, we’re realistically talking about a gross of $100 to the artist and then deducting the hard production costs (which are almost always sold to the artist at retail, not wholesale or distributor pricing) , and shipping expense to the gallery. The artist must be incredibly fast to make ends meet. Otherwise, this doesn’t look like a workable business model for profit. Did these lower priced sales lead to the sale of higher value items from the same person? Again, in past Red Dot blogs, you have mentioned the perception of art as a luxury item and low pricing sometimes leading potential buyers to question the value of a work. Could the low priced artworks detract from artist being able to sell their higher value works? I hope you can give us all some advice and counsel on this. Thanks!